Green patents: instruments against climate change and related social inequalities

DOI reference: 10.1080/13673882.2024.00001005
By Fernando H. Taques (email), Universidad Autónoma de Madrid and Coro Chasco (email), Director, Spatial and Regional Economics Group Department of Applied Economics, RSA Ambassador to Spain, Universidad Autónoma de Madrid.
Climate change represents not solely a global environmental challenge but also a matter of social justice, exacerbating existing inequalities and spanning disparities between underprivileged populations and developed nations. Sustainable patents or “green patents” protect inventions that contribute to environmental sustainability, such as clean energy, green transportation, waste management, etc. Hence, they can mitigate the effects of climate change in several ways. Under certain circumstances, they can facilitate the transfer and dissemination of sustainable innovations and technologies across countries and regions, especially from developed to developing countries, where the needs and opportunities for climate action are the greatest. For this reason, it is interesting to learn more about this type of patent, their evolution over time and their distribution in geographical space.
The European Patent Office (EPO) classifies climate change mitigation patents according to the Cooperative Patent Classification (CPC), specifically in codes Y02 and Y04S. The first group encompasses technologies or applications focusing on mitigation or modifications for climate change and immaculate energy. The second group is characterised by information or communications that impact other technological areas, particularly smart grids. The classes and subclasses of each group are shown in Table 1.
Table 1. Subgroups of Section Y of climate change mitigation technologies.
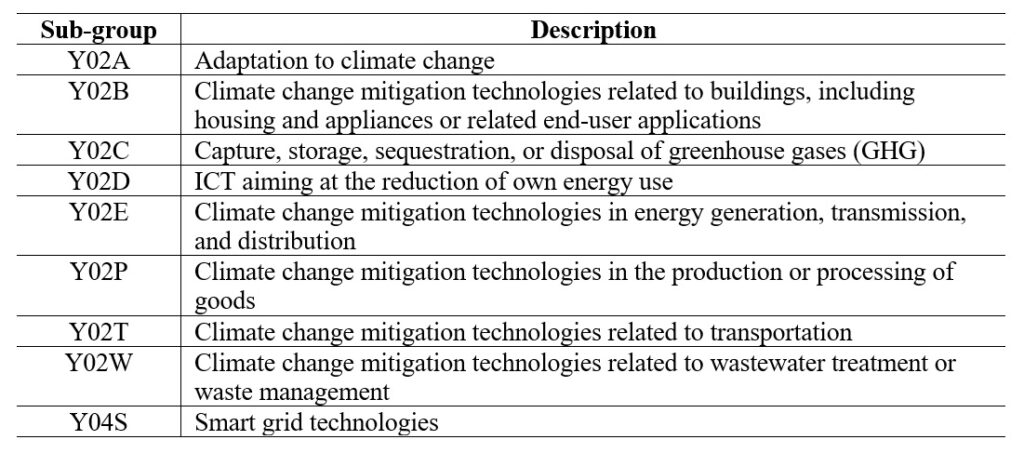
Source: EPO (2016), and Espacenet (2023).
The database of climate change mitigation patents originates from the EPO. The data is available through the PATSTAT product, which has Autumn and Spring versions, updated every six months (PATSTAT, 2023). The dataset selected for this research corresponds to PATSTAT Global 2023 – Spring, encompassing the consolidation of data until the end of 2022 and the initial records for the year 2023. It must be said that although some patents have more than one CPC, only the first registered or ‘main code’ has been considered to avoid counting patents more than once.
There is a predominance of patents in groups Y02E, Y02P, and Y02T, representing 69.26% of the total. Patents in group Y02E relate to the generation of energy from renewable sources, nuclear-origin energy, technologies that mitigate combustion, technologies developed for electrical energy, the use of technologies directed towards non-fossil fuel production, and technologies and systems aimed at mitigating greenhouse gas (GHG) emissions. Innovations in group Y02P specifically pertain to metal and mineral processing technologies, the chemical industry, petroleum refining, petrochemical industry, and those directed towards agriculture, livestock, and agri-food industries are mentioned. Group Y02T is dedicated to sustainable innovations specific to road transport of goods or passengers (whether by road or rail), those intended for air transport or aeronautics, maritime or waterway transport, or technologies aimed at mitigating greenhouse gas emissions, provided they fall within this sector.
Patenting activity in environmental technologies is more recent than in other new sectors like biotechnologies and has developed faster than nanotechnologies (OECD, 2013). The evolutionary trend of sustainable patents shows modest growth in the 1970s, followed by more significant growth rates from 1990 and exponential growth in the 2000s, as shown in Figure 1. Until 2022, 7,020,159 applications for green patents were registered, with 27,696 records (0.39% of the sample) not classified with a valid annual period.
Figure 1. Time evolution of green patents.
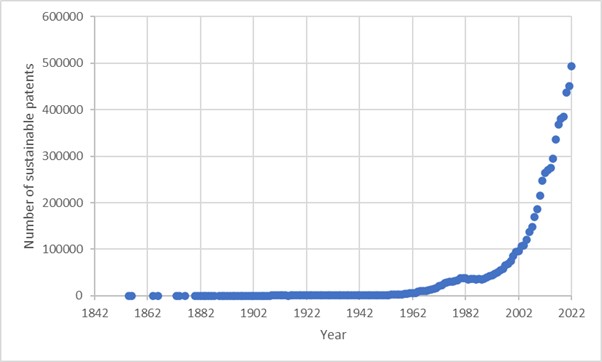
Source: Authors’ own elaboration with PATSTAT data.
From a geographical perspective, the database allows segmentation by continent and nation. With a dataset of 2,874,679 sustainable patent applications in the EPO database over time, there is a predominance for Asia (34.70%), Europe (33.79%), and North America (28.23%). Another factor is that African, Australian, Oceania, and South American records represent less than 2% of the sample. Figure 2 highlights the set of 20 countries that are responsible for 94.43% of the total sustainable patents. On the other hand, the rest of the nations have a relative representation below 0.2% in the sample set, that is, 5,490 patent application requests throughout the entire time series. This does not imply that this set of nations cannot drive sustainable innovations measured by green patents or that inventors do not appropriately register these patents worldwide. Since the registration of sustainable innovation can be solely at the national level, only individual assessments in each country can provide a complete understanding of the innovative dynamics of sustainable patents.
Figure 2. Spatial distribution of green patents.
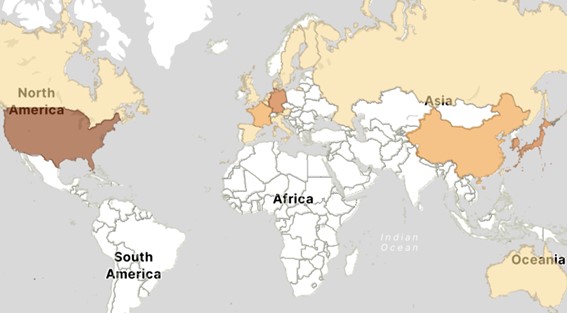
Source: Authors’ own elaboration with GeoDa software.
Therefore, although green patents can play an essential role in reducing the social divide produced by climate change, they are not sufficient by themselves. They need to be complemented with other measures that foster cooperation and diffusion of sustainable technologies among different actors and stakeholders, such as governments, businesses, civil society, and academia, to address the common challenges and opportunities of climate change. For example, some patent holders have pledged to share their green technologies with others, either for free or for a nominal fee, to accelerate the diffusion and adoption of these technologies (Awad, 2015). This is a crucial measure to eliminate the barriers and costs of accessing sustainable technologies, especially for those who lack the financial and technical resources to license green patents in developing countries.
The authors acknowledge funding from the 2022 Regional Studies Association Small Grant Scheme on Pandemics, Cities, Regions & Industry: “Effects of the Covid-19 Pandemic on Green Patents in the Eurozone”.
References
Awad, B. (2015). Global Patent Pledges: A Collaborative Mechanism for Climate Change Technology (CIGI Papers No. 81, p. 20). CIGI.
EPO. (2016). Guidelines for examination in the European Patent Office. European Patent Office.
Espacenet. (2023). Espacenet – patent classification.
IEA. (2021). Patents and Energy Transition: Vol. April, 2021. International Energy Agency & European Patent Office.
OECD. (2013). OECD Regions at a Glance 2013: Vol. November, 2013. Organisation for Economic Co-operation and Development.
PATSTAT. (2023). PATSTAT Global 2023—Single edition (Autumn) | PATSTAT (bulk data sets) | Bulk data sets | Data and services | EpoShop Site.
About the authors
Fernando Taques is a postdoctoral researcher at the Autonomous University of Madrid – UAM (Spain) and also at the Federal University of Pernambuco – UFPE/CAA (Brazil). His research involves the themes of geography of innovation, organizational innovation, and analysis of econometric models at a regional level.

Coro Chasco is RSA Ambassador to Spain, full professor in the Department of Applied Economics at the Autonomous University of Madrid, and co-editor of Spatial Economic Analysis. She is a researcher in spatial econometrics applied to the analysis of regional inequalities, quality of life and environment.