Establishing the extent and pace of the contemporary trend of migration decline in Europe

DOI reference: 10.1080/13673882.2018.00001008
By Francisco Rowe
Geographic Data Science Lab, Department of Geography and Planning, University of Liverpool, Liverpool, United Kingdom.
Francisco Rowe analyses trends in internal migration patterns across 27 European countries, revealing an as yet unappreciated variety of migration levels across European regions that poses a significant challenges to regional policymaking.
:Introduction:
Internal migration is an integral component of national development. At a national level, internal migration underpins the efficient functioning of the labour and housing markets. It is key to economic resilience by bringing knowledge, skills and labour to regions where they are needed, to enhance economic productivity. Internal migration provides a mechanism through which individuals circumvent local hazards and pursue personal aspirations.
As countries develop, the intensity, composition and patterns of internal migration are expected to evolve in systematic ways. Levels of mobility are expected to increase with development. High levels of mobility are assumed to prevail in developed societies resulting from the increasing pace of technological change, coupled to economic and cultural globalisation (Bernard et al., 2017). This assumption has resulted in the widespread belief that we live in an era of hypermobility. Yet the percentage of people migrating between countries has remained remarkably stable (Abel and Sander, 2014) – and recent evidence from various countries (e.g. Champion et al., 2017a), and a global set of countries (Bell and Charles-Edwards, 2013) suggests that internal migration has been declining over the last three decades.
While this decline is likely to have wide-ranging implications for the functioning of the economy, it remains poorly recognised and understood. Local governments have been concerned that the decline in internal migration heralds a less flexible economy where workers do not move to regions with jobs, undermining the role of mobility in regulating labour imbalances. Internal migration is the main driver of changing settlement patterns within countries, so understanding declining migration levels is critical to plan for infrastructure delivery and forecast housing needs in order to develop appropriate evidence-based policy responses.
This article presents some of the key findings of a Regional Studies Association funded project on internal migration in Europe – “Understanding the declining trend in internal migration in Europe”. The project aims to examine the long-term trend of migration rates in 27 European countries. Specifically, two of the key aims are:
(1) to assess the prevalence of migration decline in Europe; and,
(2) to establish the start and pace of this contemporary trend.
The current article will present some key findings and provide some details of the complexities in terms of spatial and temporal data harmonisation for the analysis of internal migration trends. Efforts have been made to cover an extended period of time going back to the 1970s based on annual data. However, lengthy time series are only available for a handful of countries, and when available, discrepancies in consistent population and geography boundaries over time makes temporal comparability challenging. This paper draws on recent methodological advancements developed as part of the Internal Migration Around the Globe (IMAGE) project, including bespoke software, the IMAGE Studio, to compute comparable migration rates which are independent of the size and number of spatial units used for measurement – and a global repository of internal migration data (Bell et al., 2015). We extended and updated population register data from the IMAGE global repository to produce a time-series of annual migration records. The temporal coverage varies widely from 6 years for Latvia to 36 years for England and Wales [The author acknowledges and thanks Professor Tony Champion for kindly sharing the geographically consistent data set that he assembled to examine internal migration trends in England and Wales (see Champion and Shuttleworth, 2017). First, complexities in data harmonisation for the analysis and comparability of internal migration data are presented, followed by a backdrop of the wide differences in the intensity of internal migration across European countries. Then the prevalence, timing and duration of internal migration trends are analysed and final remarks are provided.
Internal Migration Data Issues
Forty one of the fifty countries in Europe gather data on internal migration, but the methods of data collection differ in the type of data and the interval over which migration is recorded. Data are collected through one or a combination of these sources: population registers, censuses and/or surveys. Yet population registers and censuses collect different information. While censuses record migration transitions which returns numbers of migrants, population registers record migration events which returns numbers of migrations. Within an interval of time migrants can make more than one migration. For long-time intervals, migrations and events may produce different mobility patterns. In Europe, however, this problem is minimised by the availability of migration data measured on a one-year interval. These data produce negligible differences in the number of migrants and migrations. Temporal analysis of internal migration patterns represents a major challenge. Appropriate data are only available for a limited number of countries and are scarcely in the structure of a consistent time series. Censuses are conducted sporadically, at five or ten year intervals, and are affected by changes in the way migration is recorded. Census data cannot therefore capture short-term oscillations in migration rates making it difficult to establish the persistence of migration trends.
Population registers generally provide frequent data on an annual basis, but often cover a small number of years. In Europe, 28 countries provide annual migration data for at least a six-year period, enabling the capture of both short-term oscillations and persistence in internal migration patterns. Data are, however, affected by changes in administrative boundaries creating inconsistent geographies over time. To overcome this problem, harmonisation approaches have been applied to produce consistent spatial frameworks for internal migration analysis. Drawing on these approaches, we tracked back and adjusted boundary changes to the most recent geography possible in order to create temporally consistent geographies for our sample of countries (Rowe, 2017).
In addition, levels of geographical aggregation at which countries collect migration data differ, capturing different migration trends. While local moves are typically related to housing factors, long-distance migration is more closely linked to employment contingencies. Functional labour market areas have been proposed to harmonise migration observed at different spatial scales (Casado-Díaz et al., 2017), but these approaches rely on commuting data which is not widely available and require expert knowledge for parameter calibration. Some measure of harmonisation can, however, be achieved by using the commonly recognised split between major regions (e.g. states) and minor regions (e.g. municipalities).
For this paper, we draw on annual data from population registers for 27 countries to measure internal migration rates for at least six continuing years. Time-series data for 17 countries were obtained from the global IMAGE repository. The data was updated to include more recent data and 10 additional countries, boundary changes were also identified and adjusted to produce temporally consistent data based on official correspondence files from Eurostat. The temporal coverage of time series varies widely from 6 years to 36 years (Table 1). To distinguish the distinct set of factors acting to shape migration patterns at each geographical scale, we also endeavour to distinguish moves between major regions and between minor regions, broadly capturing long-distance moves and short-distance moves, respectively. Variations in the length of time series at these two levels of geography are also noted. The temporal coverage is generally longer at the major geographical scale and focuses on the last and first decade of the 20th and 21st centuries. Yet time series for certain countries extends back from the 1970s and 1980s to the 2010s.
Table 1. List of countries, time periods, scales and number of regions.
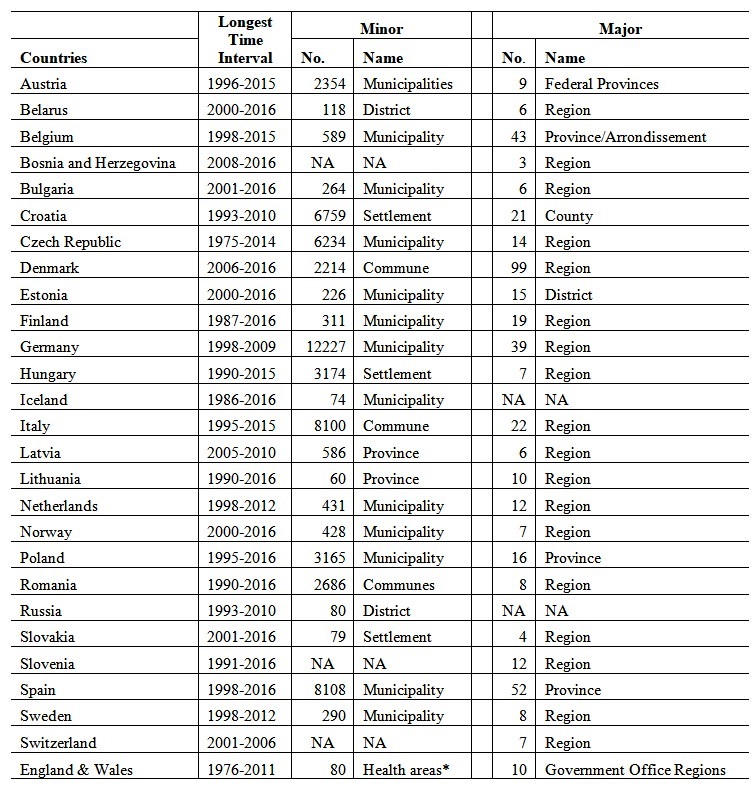
* The data for England and Wales for minor regions correspond to moves between health areas within each government office regions.
Cross-country differences
To contextualise the analysis of temporal migration trends, it is useful to first determine differences in the overall intensity of internal migration across countries. To this end, we draw on recent Aggregate Crude Migration Intensity (ACMI) estimates from Bell et al. (2017). Migration rates are affected by the modifiable areal unit problem; that is, the number of units and the way in which an area can be organised. The ACMI overcomes these problems providing a reliable indicator to compare migration intensities across countries. The ACMI is computed as the total number of changes of address in a country divided by the population at risk of migrating (i.e. the mid-year population).
Figures 1 and 2 ranks and maps the ACMI for 33 European countries and sets this against a global sample of 47 countries, including all world regions as reported by Bell et al. (2017). A pattern of wide variability predominates in Europe with ACMIs ranging from just over 1% per annum in Macedonia to over 15% in Finland and Iceland and levels of around the global average in Ireland, Greece, Hungary and the Netherlands. As identified by Rowe et al. (2017), a clear spatial pattern underpins these variations, travelling from high migration intensity in Northern and Western countries, including Iceland, Scandinavian countries and the United Kingdom, to low migration levels in Southern and Eastern European countries, encompassing Spain, Italy and ex-Soviet countries.
Figure 1. Ranking of Aggregate Crude Migration Intensity, %.

Source: IMAGE Repository, global mean across a sample of 47 countries.
Figure 2. Map of Aggregate Crude Migration Intensity, %.

Source: IMAGE Repository.
Extent and pace of decline
These relativities reveal the degree of migration within countries across Europe, but how have internal migration rates evolved in individual countries? Recent evidence has pointed to falling migration intensity in a selected number of countries around the world, including the United States, Australia and to a certain extent, the United Kingdom (Champion et al., 2017). This section analyses where, when and how long internal migration intensity has been in decline across Europe. In particular, it seeks to identify the timing, duration, persistence and set of countries undergoing this trend. Figures 3 and 4 sets out the recorded annual cumulative change in internal migration rate, computed as the ratio of the migration rate in year t to the migration rate in year 0 minus one, expressed as percentage. The starting year and length of data points vary widely across countries so direct cross-national comparability is problematic; however, the sequence of data points provide valuable information to establish the trajectory of migration intensities in individual countries. Countries are classified into sub-regional areas according to the United Nations’ geoscheme for Europe. The cumulative change in migration rates is computed for both moves between minor regions and between major regions. Migration between minor regions can be tracked for 22 countries, and between major regions for 28 countries: 21 countries are represented in both Figures 3 and 4. The long-term trajectory of migration rates is classified into four categories: rising, falling, oscillating and stable. Stable trajectories of the cumulative annual changes in migration rates are within 10%.
Figure 3. Cumulative Annual Change in Internal Migration Rate, Moves Between Minor Regions, %.


Figure 4. Cumulative Annual Change in Internal Migration Rate, Moves Between Major Regions, %.


The results reveal a predominant pattern of great diversity in migration trends. Summing across minor and major geographical regions delivers a count of 48 country cases, of which 15 cases display oscillating migration trends, 12 cases of a pattern of rising migration, 11 cases of falling intensities and 10 cases display a trend of stability.
Oscillations are apparent in Croatia, Hungary, Iceland and Italy at the minor geographical scale and also in Estonia, Hungary, Latvia, Lithuania and Poland at the major scale. For moves between minor regions, clear patterns of rising migration intensities emerge from Romania, Spain, Belgium and Finland – and from Slovakia and Austria for moves between major areas.
A contrasting picture is observed in Czech Republic where migration shows a long-term trajectory of migration decline from the 1970s to the mid-1990s, stabilising for moves between minor regions during the 2000s and 2010s, although rising markedly for moves between major regions. At the minor scale, migration intensities display a clear long-term trend of decline in Bulgaria, Latvia, the Netherlands and Russia – and at the major scale in Bosnia and Herzegovina, Bulgaria and Spain since the mid-2000s. While fluctuating, migration intensities seem fairly stable in Northern European countries, particularly in Denmark, Norway, Sweden, England and Wales at both scales, and in Finland and the Netherlands at the major scale.
These trends in migration intensities seem to be dependent on the geographical scale. The same trend prevails for only 10 of the 27 countries in the sample for both movements between minor, and movements between major regions. Only two countries, Austria and Belarus, display clear patterns of migration decline at both scales. The prevalent trend is rising or falling migration intensities at the minor scale, and oscillation or stability at the major level. A clear example is Belgium where a trend of rising migration is present at the minor scale, while oscillations are apparent at the major level. These findings indicate that in general the forces operating to shape migration intensities in European countries act differently across the urban hierarchy, rather than being confined to one particular geographical scale. They also indicate that short-distance and long-distance moves are generally driven by distinct sets of factors – which is consistent with existing evidence of long-moves being associated more closely to employment reasons, and short-distance moves to residential and family motives.
The results also reveal that no single pattern of migration trend prevails within one particular sub-region of Europe. Patterns of rising, falling, oscillating and stable migration intensities appear to manifest randomly across Northern and Southern Europe as well as across Western and Eastern Europe. Yet a pattern of a marked drop in migration intensity can be noted around the 2007-8 Global Financial Crisis (GFC), particularly across Eastern Europe, involving Belarus, Bulgaria, Poland, Romania, Latvia, but also Spain. This pattern is likely to reflect the responsiveness of internal migration to economic business cycles.
Conclusion
The accumulated evidence presented here reveals that long-term trends of migration decline are not a prevalent pattern across Europe. It is confined to a selected number of countries across the continent and the rate of decline is highly variable, covering very narrow time frames for some nations or extended numbers of years for others. The predominant picture is of great diversity, with four distinctive sets of trajectories, involving oscillating, rising, falling and stable migration intensities. These trajectories are widely scattered across the subregions of Europe, with a distinctive feature emerging in Eastern Europe where migration intensities registered a marked drop during the 2007-8 GFC. Distinctive sets of forces seem to act to shape migration intensity trends at different levels of geography, as different patterns are apparent for long-distance and short-distance migration. Understanding the set of factors operating to configure distinctive migration trajectories is crucial to develop appropriate policy responses in order to create resilient economies and labour markets as well as ensuring adequate provision of housing and infrastructure. The next aim of the wider project within which the research reported here has been developed is to determine the factors underpinning these migration trajectories.
References
Bell, M., Charles-Edward, E., Bernard, A. and Ueffing, P., (2017) “Chapter 4: Global Trends in Internal Migration”. In: Champion, T., Cooke, T. and Shuttleworth, I. eds., 2017. Internal Migration in the Developed World: Are we becoming less mobile?. Routledge, pp.76-97.
Champion, T., Cooke, T. and Shuttleworth, I. (Eds.), (2017a) Internal Migration in the Developed World: Are we becoming less mobile?. Routledge.
Rowe, F., Bell, M., Bernard, A., Charles-Edward, E., and Ueffing, P., (2017). Measuring the Impact of Internal Migration on Population Redistribution in Europe. European Regional Science Conference, Groningen, the Netherlands.